Section 2 Workspace
2.1 Create / load a workspace
When you arrive on the ASTERICS home page, you have two options:
- Create a new workspace to work with your own data. Note that clicking on “Load TCGA demo data into your workspace” will create a new workspace with demo data included.
- Load an existing workspace that you have previously created.
2.1.1 Creating a new workspace
You can create a new workspace: this will allow you to import your own data, and to perform statistical analyses with them. When a new workspace is created, a unique identifier is defined and sent to you be email (with the email that you provided on login). This unique identifier can be used to reconnect to that workspace later.
The workspace will be accessible for 30 days after your last connection. It contains the datasets that you imported, and the analyses that you performed.
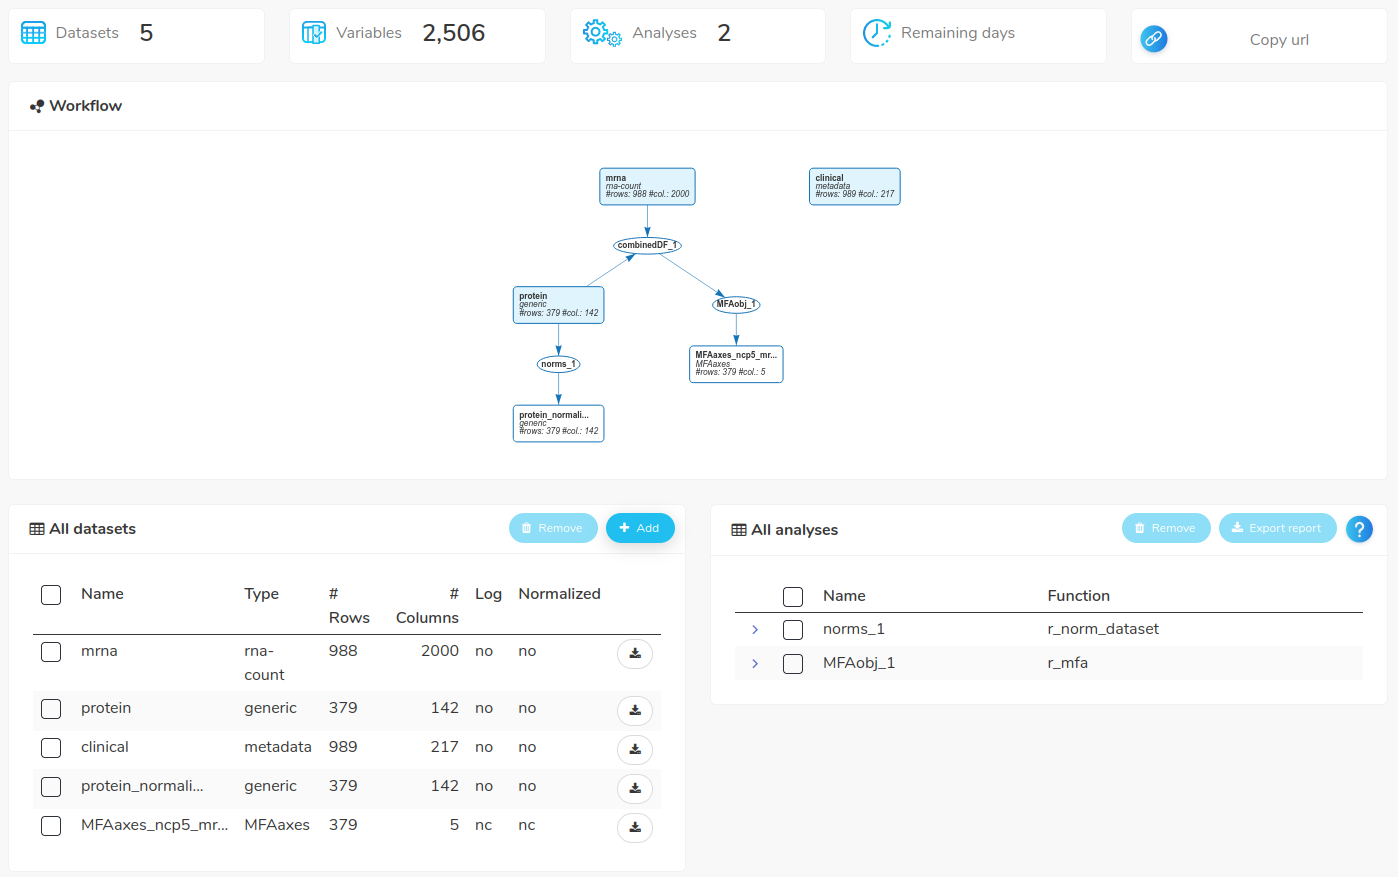
2.2 Screen “My workspace”
The screen “My workspace” is splited in four parts:
At the top, five boxes contains informations about the workspace : number of datasets, number of variables, number of analyses, remaining days before the workspace is removed (if it is not used) and a button to copy the workspace URL.
In the middle, the workflow is represented by a graph. Rectangles are the datasets and ovals are the analyses. An arrow from a dataset to an analysis indicate that this dataset is used in this analysis. An arrow from an analysis to a dataset indicate that this dataset is extracted from this analysis.
The bottom left frame lists the datasets contained in your workspace.
The bottom right frame lists the reports saved from the analyses.
2.3 Import your data
When you are on the My workspace screen, you can import data by clicking the “+” symbol above the datasets list.
2.4 Retrieve an analysis
You can click on an analysis node on the graph, and then retrieve the results by clicking the “More” button.
 to export a dataset in a csv or rda file.
2.6 Export report
By clicking on “Export report,” you can export the results of one or several analyses in an HTML report. A zip file containing one or several HTML files (one for each selected analysis) will be created for download.
Analyses are selected as shown in the image below.
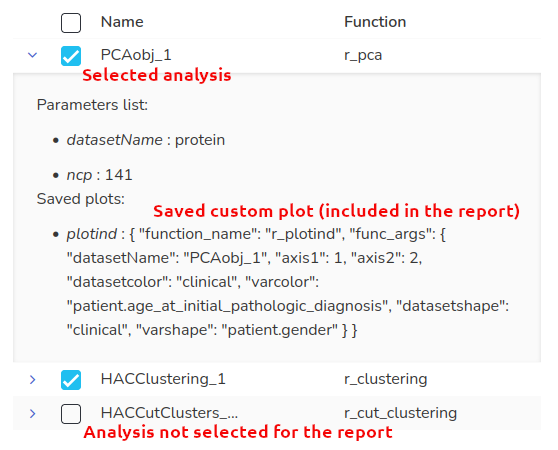
In some analysis screens, certain plots can be customized (for instance, on PCA,
the plot of individuals can be colored by any variable). These plots must be
saved individually if you want to include them in the report (using the button
 available on the corresponding screen). Saved additional plots are listed in the
analysis menu, as shown on the image on the right.
available on the corresponding screen). Saved additional plots are listed in the
analysis menu, as shown on the image on the right.
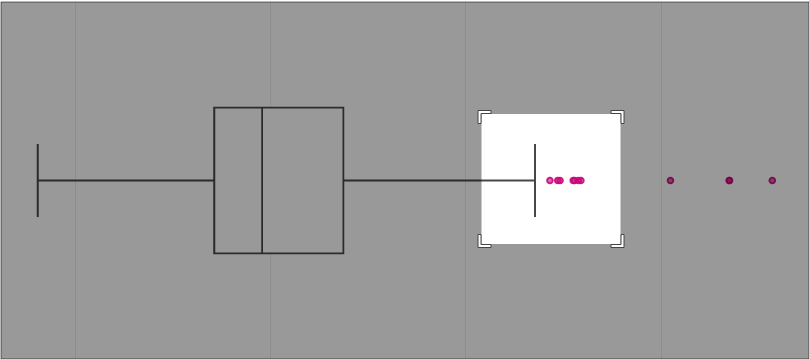
2.7 Interact with plots
Most of the graphics ASTERICS are interactive.
2.7.1 Hover
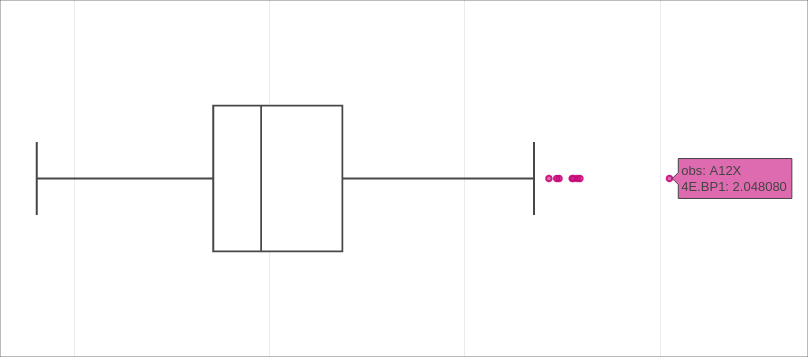 If you pass the mouse over a specific point of the graphic, you should see detailed infos.