Section 10 Clustering
Under this menu, you can perform two steps to identify and explore homogeneous clusters in a dataset:
- Choose the number of clusters based on hierarchical clustering or k-means algorithm, using one of the quality plots or the broken stick heuristic
- Explore the clusters with graphical outputs (heatmap, PCA, dendrogram), and with their frequency table. Create a new dataset containing the clusters.
Note that you cannot perform a clustering on a dataset containing more than 50,000 rows.
10.1 Choose the number of clusters
How to set options?
Options will help you obtain different quality metrics for different values of the number of clusters for a given clustering method:
if you select the hierarchical clustering method (HC), you will be able to explore all possible values of the number of clusters but the method is very slow for a large number of individuals;
if you select the k-means method, you will be able to explore a limited number of numbers of clusters (20 at maximum), obtained by setting a minimum and a maximum number, but the method is more efficient in terms of number of individuals and is meant to provide better clusters.
We advise (if your dataset size permits it) that you try the two clustering methods and different numbers of clusters, trying to check the differences between the resulting clusterings.
Important note: The clustering is performed with raw values (data are not scaled to unit variance before they are processed). If you want to perform it on scaled data, go to the menu “Edit / Dataset edition” and scale your dataset before the clustering.
10.1.1 Quality plot
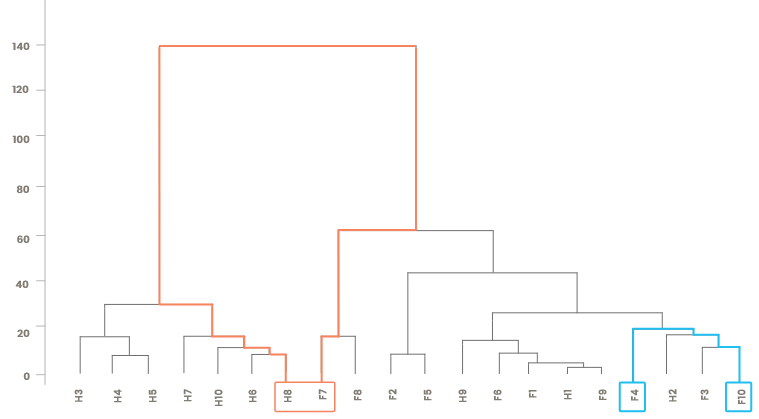
Once the number of clusters chosen, go to the tab “Make and explore clusters” to visualize them. If you used hierarchical clustering (HC), you might also want to check the “HC” tab of the help before.
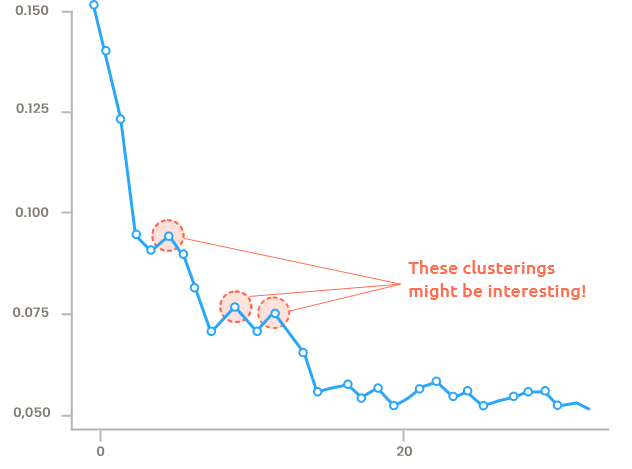
Figure 10.1: Silhouette
The silhouette (Figure 10.1) is a quality criterion for the clustering (the higher the silhouette, the better the clustering).
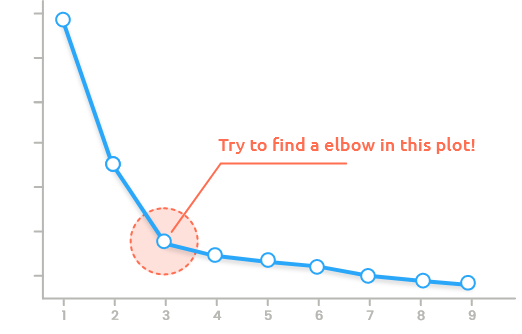
Figure 10.2: Within-dispersion
The within-dispersion (Figure 10.2) is a measure of
homogeneity of the clusters (the smaller the within-dispersion, the more similar
the individuals within clusters).
In addition, the broken stick heuristic suggests a number of clusters (without
statistical guarantee).
10.2 Make and explore clusters
How to set options?
Set a number of clusters on the left panel to explore a clustering.
Explore your clusters with the heatmap and the PCA projection or the frequency table. If you want to use your clusters in other analyses “Create a new dataset” in the “Clusters” panel and check it in menu “My workspace.”
10.3 Default parameters
Used function and default parameters:
- Case of HAC clustering:
- The used function is
fastcluster::hclustondist_mat ^ 2with the optionmethod = 'ward.D', wheredist_matis the matrix distance between individuals, using Euclidian distance.
- The used function is
- Case of Kmeans clustering:
- For each value of k, The used function is
stats::kmeanswith the optionscenters = kandnstart = 5.
- For each value of k, The used function is