Section 12 Multiple Factor Analysis (MFA)
Integrate datasets with MFA, a generalization of the PCA for cases where individuals are described by several groups of variables
- Pre-processing to ensure individuals of both datasets match (numerical description of combined datasets, Venn diagramm and upset plot)
- The method automatically balances the contribution of each group
- Graphical outputs: screeplot, projection of individuals, projection of variables on circle of correlation with highlights for group respective contributions.
- Possibility to extract a new dataset based on principal components or on selected variables.
The method used in ASTERICS comes from the FactoMineR (Lê, Josse, and Husson 2008) package.
For further information on MFA method (in French):
12.1 Preprocessing

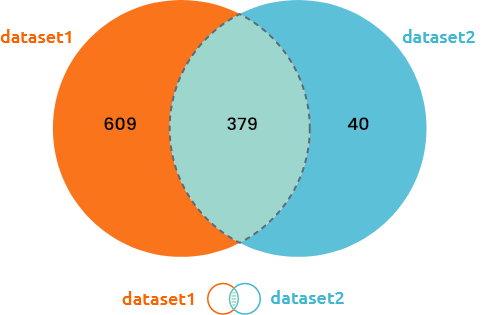
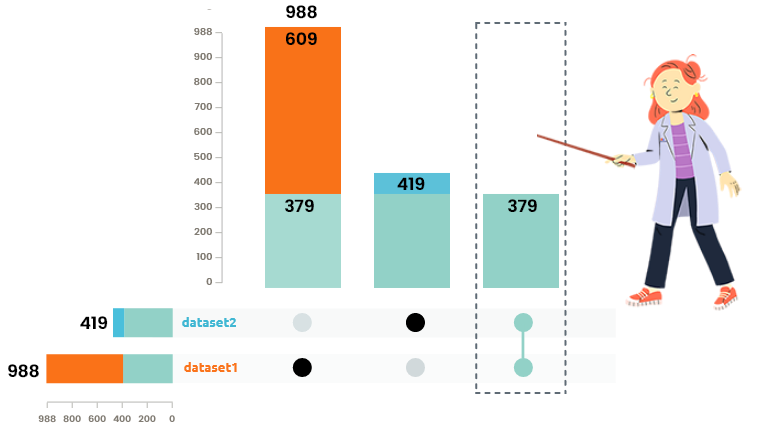
Venn diagram and upset plots are used to understand how many individuals are common / specific to each dataset. Only individuals common to all integrated datasets are used in the analysis.
12.2 Run MFA

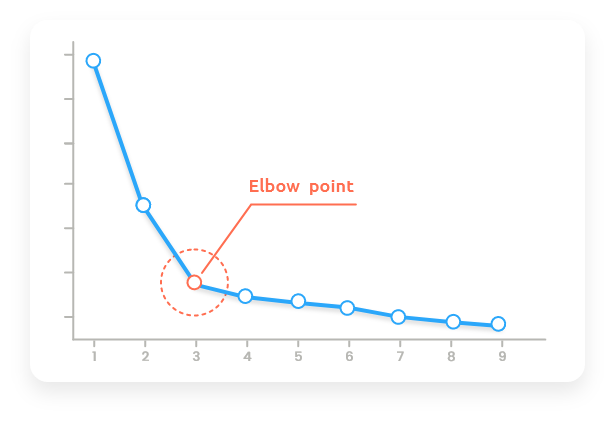
Percentage of explained variance reproduced in your MFA must be as large as possible to ensure what you see is a main trend of your dataset. Use the elbow rule (screegraph) and try to keep at least 80% of cumulative explained variance when you choose a number of principal components (PCs).
12.3 Explore individuals
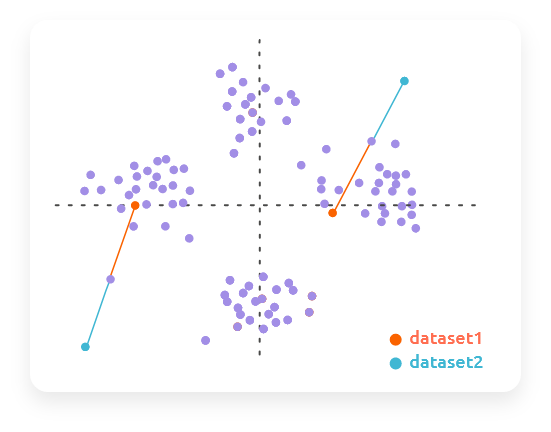
Similarly to PCA, the interpretation of MFA is done component (axis) by component, starting from the first which displays the main sources of variability between variables.

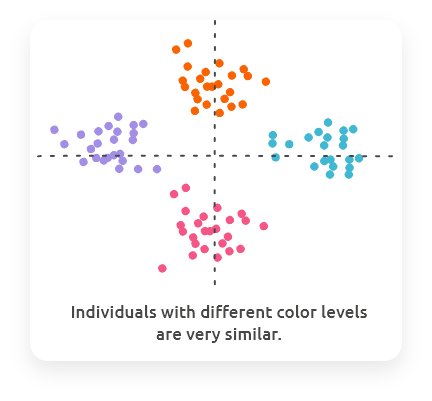
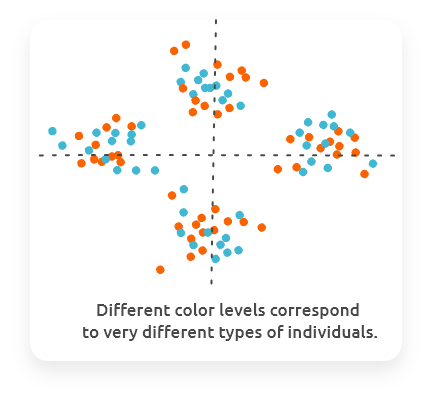
Combine the plot of individuals with colors (or shapes / sizes) giving information on other variables (e.g., variables of your design) to check if colors are organized with respect to PCs. This would mean that the main variability of your dataset are also associated to the variable that has been used to color individuals in your plot.
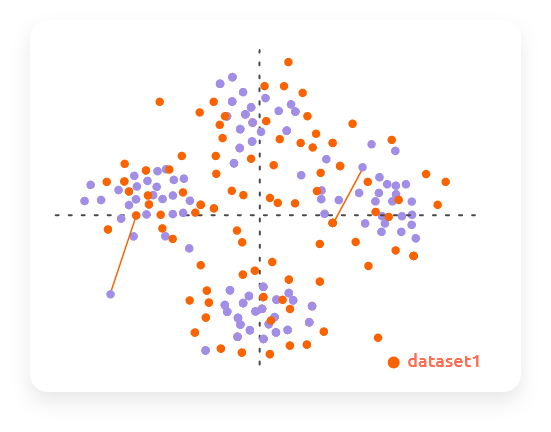
For a given group, you can display the group contribution for
every individual. It gives the position of this individual if a PCA had been
performed only with the dataset corresponding to the selected group).
For some selected individuals, you can also
display the contribution of all groups at once for these individuals.
12.4 Explore variables
How to set options?
By choosing a correlation threshold, only variables with a correlation larger than this number are displayed on the plot (to make it easier to read).
12.4.1 Interpret axes

Only variables well correlated with axes can be interpreted. Select a correlation threshold to display the most correlated variables.
12.4.2 Case of categorical variables
For MFA, the levels of the categorical variables are displayed in a space which
scale is not comparable to the correlation plot of numerical variables.
You
can explore them on an additional plot.
Distances in this space are
interpreted in terms of common co-occurrence of the two levels among
individuals (the closer the two levels on the plot, the higher the
co-occurrence of these levels).
Only levels of categorical variables
for which the reproduced correlation ratio is larger than the chosen threshold
are displayed.
12.5 Explore groups
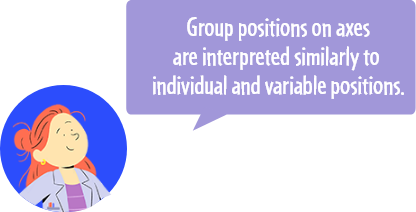
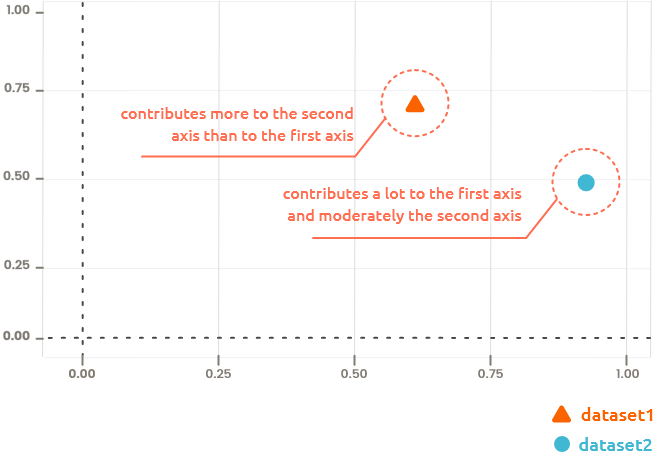
Groups are interpreted similarly to individuals and variables except that they can only have positive coordinates (so a strong contribution is on the right or on the top of the figure).
12.6 Extract new data
How to set options?
Set options in left panel to generate a new dataset from the analysis:
- with the criterion “Components, by number,” the first components (number to be specified by the user) will be extracted and used as a new dataset;
- with the criterion “Components, by explained variance” (when available), the first components (number automatically set to reach the targeted percentage of explained variance) will be extracted and used as a new dataset;
- with the criterion “Variables,” the variables the most correlated with the first components will be selected and used as a new dataset.
When the dataset is extracted, you can use it in other analyses or check it in menu “My workspace.”
12.7 Default parameters
Used function and default parameters:
The groups are driven by the type of variables they contain.
- FactoMineR::MFA with option
ncpset to the minimum between 20 and the maximum value of the PCA with all variables (min(n_num + n_lev, nrow(X) - 1)withn_numthe number of numeric variables andn_levthe total number of levels in the categorical variables minus the number of categorical variables).